Beach Profiles - Response to Oceanic Conditions
This document contains information about the fundamentals of beach profiles and is intended to help teachers improve their content knowledge of ocean wave forces and coastal geomorphic response. Background addresses some of the basic information about waves and the beach profile. Methods of Measuring Beach Profiles presents the history of how coastal scientists have developed techniques of measuring beach topography (and bathymetry). Seasonal Changes in Beach Profiles discusses the natural variability in beach shape throughout the year. Human Activities and "Natural" Coastal Protection discusses the human measures that influence the physical behavior of the coast, such as river damming and emplacement of jetties, that alter the pattern of longshore sediment movement.
Background and Terminology
Many people utilize the coast for a wide array of purposes – commercial fishing/boating, tourism, and recreation. But the coastal environment is dynamic and is one of the most rapidly changing physical environments on Earth. Because of the strong link between society and coastal change, it is advisable that we understand this environment and what causes it to change its state.
One of the most obvious changes in the coastal environment is that of the beach morphology, often quantified as the beach profile, which represents the shape of the topographic surface of the beach created by slicing through the beach from the offshore region to beyond the dunes. Beaches profiles change their shape by adjusting to the forcing conditions of the ocean (i.e. waves, tides, wind, and the resulting nearshore currents).
The shape of the beach profile determines how the coast responds to storms, what part of the beach is useable for habitat and recreation, and the legal boundaries of land ownership. The first well-documented studies of the beach profile were carried out to understand beach behavior for use in amphibious operations during World War II, when personnel and supply boats had to cross the beach profile from offshore to the beach. The profile shape varies as a function of time of year as well as time since a recent storm. Waves, water level, and sediment grain size are the principal controls of beach profile shape (Kraus, 2005).
An example showing how a typical Florida beach responds to a storm is provided in Figure 1 (from Pilkey et al., 1984). During a storm, elevated water levels allow vigorous waves to access sand that is stored high on the beach profile during fair-weather conditions. The sand entrained during the storm is re-deposited in temporarily deeper water, which reshapes the beach profile. During fair-weather conditions, waves slowly carry this "re-deposited" material back on shore to rebuild the original profile.
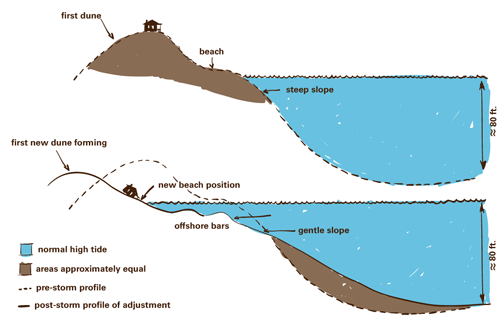
Figure 1. Typical response of a "healthy" beach to a storm event.
Approximations to a beach profile can be expressed as very simple mathematical functions. A linear approximation is provided by the relationship:
h = x tanβ
where h is the still-water depth, x is the distance from the shoreline, and tanβ is the beach slope. This approximation, defining a "planar beach" is convenient, but overly simplified. A more realistic representation of the beach profile is the "x to the 2/3rd profile":
h = A x2/3
where A is a function of the sediment grain size on the beach.
Waves are the principal agent responsible for changes in beach profile shape. The water motion within a propagating wave is in a circular or elliptical orbital, whose size and speed is set by the wave height and period (Figure 2). As waves interact with the shallow seabed, they slow to a condition where their propagation speed is exceeded by the orbital speed, at which point the wave breaks. In the breaking process, wave energy is released in the form of turbulence, which entrains sediment and allows it to be carried shoreward, seaward, or parallel to the coast, according to the direction of nearshore current flow.

Figure 2. Principal characteristics of wave motion.
Methods of Measuring Beach Profiles
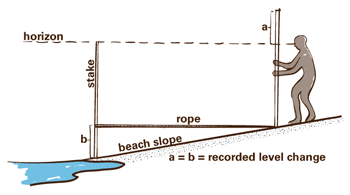
Figure 3. The "Emery board" technique of measuring beach profile shape.
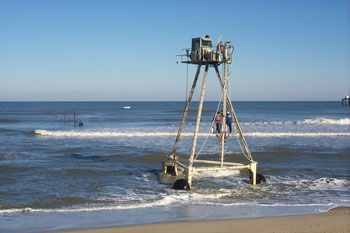
Figure 4. The Coastal Research Amphibious Buggy (CRAB) used for beach profile measurements at the U.S. Army Corps of Engineers Field Research Facility, Duck, North Carolina. Photo Credit
The techniques of measuring beach profiles have evolved significantly during the last century. Although it appears to be a straightforward task, it is more complicated than it may seem, given that a large portion of the beach profile resides under water, within a fairly energetic environment – where waves are breaking. This has caused scientific researchers to get creative in their approaches to beach profile measurement.
Perhaps the simplest technique to measuring a beach profile is known as the Emery board method, developed by a famous coastal scientist named K.O. Emery. As depicted in Figure 3 (from Komar, 1998), the apparatus consists of two stakes connected by a rope of known length (5m or 10m). This length sets the measurement interval for individual data points along the profile. Each stake has a measurement scale which runs from 0 at the top, down to the bottom of the stake. Either English or Metric units can be used, although the scientific community is nearly completely converted to the metric system. If the beach is sloping downward toward the sea, the observer sights across the top of the seaward board to the level of the horizon, and determines the distance (a) from the top of the landward board to the sightline. If the beach is locally sloping upward in the offshore direction, then (a) is measured on the seaward board and the sighting is with the horizon over the top of the landward board. In either case, the measured distance (a) is equal to the distance (b) that the beach has either dropped or risen within the horizontal distance between the boards (the rope length). (Komar, 1998) This approach may seem simple, but it provides reasonably accurate measurements of beach profiles. It also has the advantages of light, inexpensive, equipment, which can be easily carried to distant survey sights, for very rapid surveys.
Some success has been achieved in developing vehicles that can obtain beach profiles that extend across the entire nearshore and into deeper water. The "surf rover" consists of two tractors which move a steel frame through the water. Mounted upon the steel frame are instruments which record the vertical and horizontal positions of the rover. Another interesting device is the Coastal Research Amphibious Buggy (CRAB), shown in Figure 4, which stands over 30 feet tall and can survey the surf zone to water depths of approximately 9 meters.
The current state of the art beach surveying equipment utilize Real Time Kinematic (RTK) Differential Global Positioning Systems (DGPS) and can be mounted on All Terrain vehicles (4 wheelers) as well as shallow water wave runners, for use in the surf zone with echo sounder devices to profile the sea bed. Surveys of this type are planned with considerations of the tide, so that data from dry beach surveys, performed at low tide, can overlap with hydrographic surveys, performed at high tide, yielding a continuity of data.
Seasonal Changes in Beach Profiles
Changes in beach profile shape occur as a result of changing wave conditions, which can be due to a single storm of unusual magnitude, or seasonal changes in repeated storm intensity. The pattern of beach-profile response to wave intensity is illustrated schematically in Figure 5.
Along many coasts, wave activity is most vigorous during winter months and fairly mild during summer months. Accordingly, beach profiles are referred to as "winter profiles" and "summer profiles", because they reflect the natural adjustment to the seasonal wave energy. Many researchers have obtained repeated profiles over several years to illustrate this oscillation between seasonal beach states (winter vs. summer) profiles. The results from these studies have shown that beach sediment is not necessarily "lost" during erosion events, it simply moves offshore to create submarine sand bars. Beach sediment is truly lost from coastal systems, however, when the supply of sediment from rivers to the ocean is interrupted, by dams or other human activities discussed below.
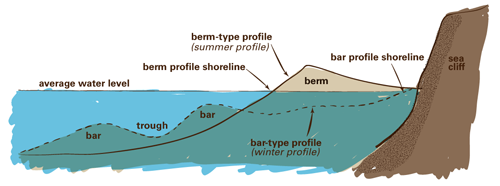
Figure 5. The bar-type profile that forms during a storm contrasted with the berm-type profile that forms during periods of fair weather.
Human Activities and "Natural" Coastal Protection
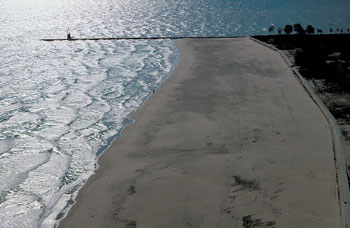
Figure 6. Jetty at Chicago, Illinois, along the Lake Michigan coast. Note the accretion (or beach growth) in the foreground of the picture, and the absence of a beach beyond the jetty. As this photo illustrates, jetties interrupt the natural flow of longshore sediment transport. Image Source: Earth Science World Image Bank http://www.earthscienceworld.org/images
How do human activities affect the shape and configuration of the beach? There are two basic processes to consider in answering this question – (1) longshore sediment transport and (2) cross-shore sediment transport.
Longshore sediment transport is the movement of sediment over long distances in a direction parallel to the shoreline. In this way, the beach itself can be considered a river of sand, whereby, the individual sand grains move (intermittently) along the coast, but there always seems to be a beach present. Rivers supply sediment to the coast and human activities, such as damming for hydroelectric power, can restrict the flow of sediment to the coast. This means that the natural supply of sediment to feed the beach is decreased and river of sand becomes starved. The natural response is a narrower beach.
Other human activities and man-made structures in the coastal zone interfere with the natural flow of sediment along beaches. Jetties which are used to stabilize inlets for boat entry, as shown in Figure 6, trap sediment "updrift" of the structure and show a net loss, or beach narrowing, downdrift of the structure.
In the above discussions of seasonal differences in beach profiles, we are considering the effects of cross-shore sediment transport – in other words, the changes that cause beaches to switch between "barred" (winter) profiles and "bermed" (summer) profiles (Figure 5). These two types of profiles result in narrow beaches in the winter and wide beaches in the summer. But if there is an overall decrease in longshore sediment transport, from a decrease in sediment supply, both the summer and winter profiles give narrower beaches than their "full supply" states.
References:
KOMAR, P.D., 1998. Beach Processes and Sedimentation. Prentice-Hall, Inc., 544pp.
KRAUS, N.C., 2005. Beach Profile, in Encyclopedia of Coastal Science, ed. by M. Schwartz. Dordrect, The Netherlands: Springer.
PILKEY JR., O.H., D.C. SHARMA, H.R. WANLESS, L.J. DOYLE, O.H. PILKEY SR., W.J. NEAL, and B.L. GRUVER, 1984. Living with the East Florida Shore. Durham, N.C.: Duke University Press, 259pp.