Maps Site map
  FL Maps > Region > 1950-1999
Site Map  

  Record   76   to   100  of   261

St. Johns River: Lake Dexter and Lake Woodruff, 1979
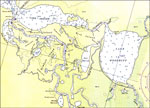
A National Oceanic and Atmospheric Administration map of the St. Johns River around Lake Dexter and Lake Woodruff current to 1979. This National Ocean Survey chart shows all soundings expressed in feet. Navigational aids such as lights, and beacons a...

St. Johns River: Lake Harney, 1979
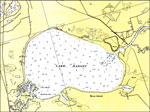
A National Oceanic and Atmospheric Administration map of the St. Johns River near Lake Harney current to 1979. This National Ocean Survey chart shows all soundings expressed in feet. This map shows marshes, inland waters such as Lake Harney and other...

St. Johns River: Sanford, 1979
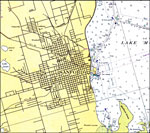
A National Oceanic and Atmospheric Administration map of the St. Johns River near Sanford current to 1979. This National Ocean Survey chart shows all soundings expressed in feet. Navigational aids such as lights, beacons, and buoys are shown as well ...

St. Johns River: Racy Point to Crescent Lake, 1980
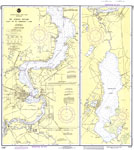
A National Oceanic and Atmospheric Administration map of the St. Johns River from Racy Point to Crescent Lake, current to 1980. This East Coast Survey chart shows all soundings expressed in feet. Navigational aids such as lights, beacons, buoys and m...

St. Johns River: Jacksonville to Racy Point, 1980
A National Oceanic and Atmospheric Administration map of the St. Johns River from Jacksonville to Racy Point, current to 1980. This East Coast Survey chart shows all soundings expressed in feet. Navigational aids such as lights, beacons, buoys and me...

Jacksonville, 1980
A US Geological Survey and National Ocean Service map of the area adjacent to Jacksonville current to 1980. The map shows both topographic and bathymetric features. Topographic contour lines are shown at 5-meter intervals. Bathymetric contour interv...

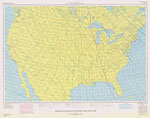
Magnetic Declination In The United States - Epoch 1980, 1980
Map of the United States showing lines of equal magnetic declination and equal annual change. Lines of equal magnetic declination (isogonic lines) are shown in red. The lines are solid where the compass points east of true north (east declination),...

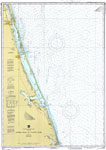
Bethel Shoal to Jupiter Inlet, 1980
A National Oceanic and Atmospheric Administration map of the area from Bethel Shoal to Jupiter Inlet current to 1980. This Department of Commerce chart shows all soundings expressed in feet at mean lower low water. Navigational aids such as lights, b...

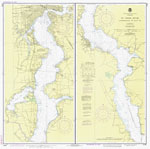
St. Johns River: Palatka, 1980
A National Oceanic and Atmospheric Administration map of the St. Johns River at Palatka, Florida current to 1980. This East Coast Survey chart shows all soundings expressed in feet. Navigational aids such as lights, beacons, and buoys are shown as we...

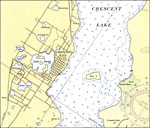
St. Johns River: Crescent City, 1980
A National Oceanic and Atmospheric Administration map of the St. Johns River at Crescent City, Florida current to 1980. This East Coast Survey chart shows all soundings expressed in feet. Navigational aids such as measures of magnetic declination var...

St. Johns River: Murphy Island and San Mateo, 1980
A National Oceanic and Atmospheric Administration map of the St. Johns River west of San Mateo to Murphy Island current to 1980. This East Coast Survey chart shows all soundings expressed in feet. Navigational aids such as lights, beacons, and buoys ...

St. Johns River: Green Cove Springs, 1980
A National Oceanic and Atmospheric Administration map of the St. Johns River at Green Cove Springs, Florida current to 1980. This East Coast Survey chart shows all soundings expressed in feet. Navigational aids such as lights, beacons, and buoys are ...

Apalachicola Bay to Cape San Blas, 1980
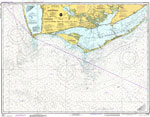
A National Oceanic and Atmospheric Administration map covering the Gulf Coast from Cape San Blas east to Carrabelle Beach on the Apalachicola Bay current to 1980. This National Ocean Survey chart shows all soundings expressed in feet. Navigational ai...

Average Discharge from Major Canals in South Florida, 1980 to 1989
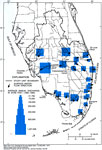
This map from the U. S. Geological Survey Circular 1134, The South Florida Environment, shows the average annual discharge, in acre-feet, from major canals in south Florida based on data from 1980 to 1989. The map also shows the direction of surface ...

Charlotte Harbor, 1981
A US Geological Survey and National Ocean Service map of the Charlotte Harbor area current to 1981. The map shows both topographic and bathymetric features. Topographic contour lines are shown at 5-meter intervals. Bathymetric contour intervals are ...

Fernandina Beach, 1981
A US Geological Survey and National Ocean Service map of the Fernandina Beach area, Florida, including portions of Camden County, Georgia current to 1981. The map shows both topographic and bathymetric features. Topographic contour lines are shown at...

Tampa Bay to Cape San Blas, 1981
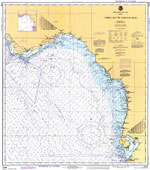
A National Oceanic and Atmospheric Administration map covering the Gulf Coast from Cape San Blas south to Tampa Bay current to 1981. This National Ocean Survey chart shows all soundings expressed in fathoms. Navigational aids such as lights, beacons,...

Well Fields of Tampa Bay Area, 1981
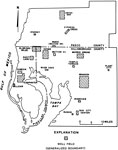
This map from the U. S. Geological Survey Open-File Report 81-1060, Estimated Water Use in the Southwest Florida Water Management District and Adjacent Areas, 1980, shows the location of well fields in Hillsborough, Pasco, and Pinellas Counties....

Lighthouse Point, 1982
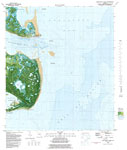
A US Geological Survey and National Ocean Service map of the Gulf Coast from Lighthouse Point to Whetstone Point current to 1982. The map shows both topographic and bathymetric features. Topographic contour lines are shown at 2-meter intervals with s...

Indian Pass, 1982
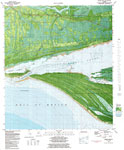
A US Geological Survey and National Ocean Service map of the area adjacent to Indian Pass current to 1982. The map shows both topographic and bathymetric features. Topographic contour lines are shown at 2-meter intervals with supplemental contour int...

Beacon Hill, 1982
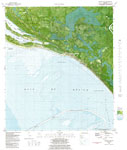
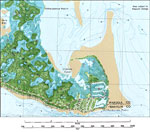
A US Geological Survey and National Ocean Service map of the Gulf Coast from Beacon Hill to Crooked Island current to 1982. The map shows both topographic and bathymetric features. Topographic contour lines are shown at 2-meter intervals with supplem...

Mashes Island, 1982
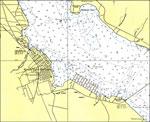
A US Geological Survey and National Ocean Service detail map of Mashes Island, current to 1982. The map shows both topographic and bathymetric features. Topographic contour lines are shown at 2-meter intervals with supplemental contour intervals at 1...

Spatial Distribution of Phosphorus Concentrations, Discharge, Loads, and Standard Error in Load Estimates for Lake Okeechobee, 1982 to 1991
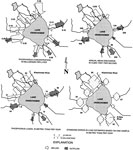
These maps from the U. S. Geological Survey Water Resources Investigation Report number 97-4011, An Optimized Network for Phosphorus Load Monitoring for Lake Okeechobee, show the spatial distribution of average phosphorus concentration in milligrams ...

Delray Beach Quadrangle, 1983
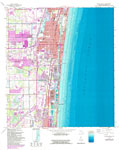
A US Coast and Geodetic Survey and National Ocean Service map of south Florida from Boca Raton to Delray Beach, current to 1983. This topographic-bathymetric map shows elevations and depths in meters. Contour interval 5 meters. Bathymetric contour ...

Lake Worth Quadrangle, 1983
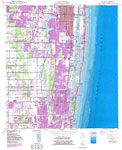
A US Coast and Geodetic Survey and National Ocean Service map of south Florida from Boca Raton to Delray Beach, current to 1983. This topographic-bathymetric map shows elevations and depths in meters. Contour interval 5 meters. Bathymetric contour ...

First Previous Next Last


  FL Maps > Region > 1950-1999
Site Map  

Maps ETC is a part of the Educational Technology Clearinghouse
Produced by the Florida Center for Instructional Technology © 2007
College of Education , University of South Florida