Maps Site map
  FL Maps > Region > 1950-1999
Site Map  

  Record   26   to   50  of   261

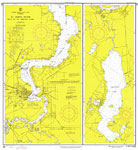
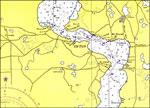
St. Johns River: Racy Point to Crescent Lake, 1970
A National Oceanic and Atmospheric Administration map of the St. Johns River, from Racy Point to Crescent Lake current to1970. This Survey chart shows all soundings expressed in feet. Navigational aids such as lights, beacons, buoys and measures of m...

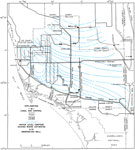
The Shallow Aquifer of Southwest Florida- Low Water-Level Contours, 1971
This is a map showing low water-level contours of the shallow aquifer for early May 1971. It shows the location of wells and the variation in water level. The water level is indicated by blue contour lines. It also shows cities, counties, roads, cana...

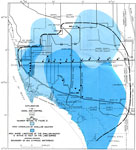
The Shallow Aquifer of Southwest Florida- Approximate Areal Extent, 1972
This is a map showing the areal extent of the shallow aquifer of southwest Florida, current to 1972. It also shows the area where limestone is within 10 feet of the land surface. Cities, counties, roads, canals, wells and inland waters are also shown...

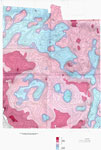
Bouguer Anomaly Map of the Florida Peninsula and Adjoining Continental Shelves, 1972
This is a Bouguer Anomaly map of the Florida peninsula and adjoining continental shelves, current to 1972. These types of maps show variations in gravity from place to place using the Bouguer anomaly created by Pierre Bouguer. "This map was prep...

Cape Canaveral to Key West, 1974
A National Oceanic and Atmospheric Administration map of the coastline between Cape Canaveral and Key West current to1974. This Survey chart shows all soundings expressed in fathoms. Navigational aids such as lights, beacons, buoys and measures of ma...

Jupiter Inlet to Fowey Rocks, 1974
A National Oceanic and Atmospheric Administration map of South Florida, from Jupiter Inlet to Fowey Rocks, current to 1974. This Department of Commerce chart shows all soundings expressed in feet at mean lower low water. Navigational aids such as lig...

Hydrology of the Oklawaha Lakes Area of Florida- Figure 1, 1974
This is a map showing the Oklawaha lakes area, current to 1974. "Lakes Apopka, Carlton, Beauclair, Dora, Eustis, Harris, Little Harris, Griffon and Yale are part of a chain of lakes that is the most prominent feature of the upper Oklawaha River ...

Pensacola Bay and Approaches, 1975
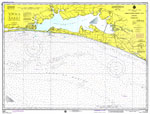
A portion of the National Oceanic and Atmospheric Administration map of Pensacola Bay and Approaches current to 1975. This National Ocean Survey chart shows all soundings expressed in feet. Navigational aids such as safety fairways, visual markers su...

Chocktawhatchee Bay, 1975
A National Oceanic and Atmospheric Administration map of the entrance to Chocktawhatchee Bay current to 1975. This National Ocean Survey chart shows all soundings expressed in feet. Navigational aids such as lights, beacons, buoys, and measures of ma...

Chocktawhatchee Bay, 1975
A National Oceanic and Atmospheric Administration map of the entrance to Chocktawhatchee Bay current to 1975. This National Ocean Survey chart shows all soundings expressed in feet. Navigational aids such as lights, beacons, buoys, and measures of ma...

St. Johns River: Dunns Creek to Lake Dexter, 1976
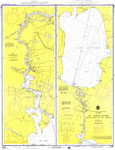
A National Oceanic and Atmospheric Administration map of the St. Johns River from Dunns Creek to Lake Dexter, current to 1976. This National Ocean Survey chart shows all soundings expressed in feet. Navigational aids such as lights, beacons, buoys an...

St. Johns River: Astor, 1976
A National Oceanic and Atmospheric Administration map of the St. Johns River near Astor, Florida current to 1976. This National Ocean Survey chart shows all soundings expressed in feet. Navigational aids such as lights, beacons, and buoys are shown a...

St. Johns River: Drayton, 1976
A National Oceanic and Atmospheric Administration map of the St. Johns River near Dreyton Island, Florida current to 1976. This National Ocean Survey chart shows all soundings expressed in feet. Navigational aids such as lights, beacons, and buoys ar...

St. Johns River: Norwalk, 1976
A National Oceanic and Atmospheric Administration map of the St. Johns River near Norwalk, Florida current to 1976. This National Ocean Survey chart shows all soundings expressed in feet. Navigational aids such as lights, beacons, and buoys are shown...

St. Johns River: Wakela, 1976
A National Oceanic and Atmospheric Administration map of the St. Johns River near Wakela, Florida current to 1976. This National Ocean Survey chart shows all soundings expressed in feet. Navigational aids such as lights, beacons, and buoys are shown ...

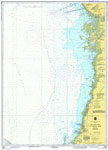
Anclote Keys to Crystal River, 1977
A National Oceanic and Atmospheric Administration map of the Florida Gulf Coast from the Anclote Keys to Crystal River. This National Ocean Survey chart shows all soundings expressed in feet. Navigational aids such as safety fairways, and visual mar...

Intercoastal Waterway: Tampa Bay to Anclote Anchorage, 1977
A National Oceanic and Atmospheric Administration map of the Intercoastal Waterway from Tampa Bay to the Anclote Anchorage. This National Ocean Survey chart shows all soundings expressed in feet. Navigational aids such as safety fairways, and visual...

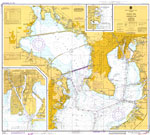
Tampa Bay Northern Part, 1977
A National Oceanic and Atmospheric Administration map of the northern part of Tampa Bay. This Gulf Coast Survey chart shows all soundings expressed in feet. Navigational aids such as safety fairways, and visual markers such as lights, buoys, and bea...

Tampa Bay Southern Part, 1977
A National Oceanic and Atmospheric Administration map of the entrance to Tampa Bay. This National Ocean Survey chart shows all soundings expressed in feet. Navigational aids such as safety fairways, and visual markers such as lights, buoys, and beac...

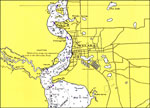
St. Johns River: Jacksonville to Racy Point, 1977
A National Oceanic and Atmospheric Administration map of the St. Johns River from Jacksonville to Racy Point, current to 1977. This East Coast Survey chart shows all soundings expressed in feet. Navigational aids such as lights, beacons, buoys and me...

Doboy Sound to Fernandina, 1977
A National Oceanic and Atmospheric Administration map of northern Florida and southern Georgia from Doboy Sound to Fernandina, current to 1977. This National Ocean Survey chart shows all soundings expressed in feet. Navigational aids such as lights, ...

Cumberland Sound: Fernandina Harbor to Kings Bay, 1977
A National Oceanic and Atmospheric Administration map of northern Florida and southern Georgia from Fernandina Harbor to Kings Bay, current to 1977. This National Ocean Survey chart shows all soundings expressed in feet. Navigational aids such as lig...

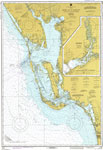
Estero Bay to Lemon Bay, Including Charlotte Harbor, 1977
A National Oceanic and Atmospheric Administration map of Gulf Coast from Estero Bay to Lemon Bay, including Charlotte Harbor current to 1977. This Department of Commerce chart shows all soundings expressed in feet at mean lower low water. A detailed...

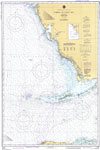
Habana to Tampa Bay, 1977
A National Oceanic and Atmospheric Administration map of Gulf Coast, from Tampa Bay to Havana, Cuba, current to 1977. This Department of Commerce chart shows all soundings expressed in fathoms at mean low water. Navigational aids such as lights, beac...

Continuation of Peace River, 1977
A National Oceanic and Atmospheric Administration map of Peace River current to 1977. This Department of Commerce chart shows all soundings expressed in feet at mean lower low water. Navigational aids such as lights, beacons, buoys and measures of ma...

First Previous Next Last


  FL Maps > Region > 1950-1999
Site Map  

Maps ETC is a part of the Educational Technology Clearinghouse
Produced by the Florida Center for Instructional Technology © 2007
College of Education , University of South Florida